> For the complete documentation index, see [llms.txt](https://docs.dashboard.devtron.ai/llms.txt). Markdown versions of documentation pages are available by appending `.md` to page URLs; this page is available as [Markdown](https://docs.dashboard.devtron.ai/user-guide/resource-browser/nodes.md).
# Nodes and Operations
You can see the list of nodes available in your cluster. Typically you have several nodes in a cluster; in a learning or resource-limited environment, you might have only one node.
The components on a typical node include the `kubelet`, a `container runtime`, and the `kube-proxy`.
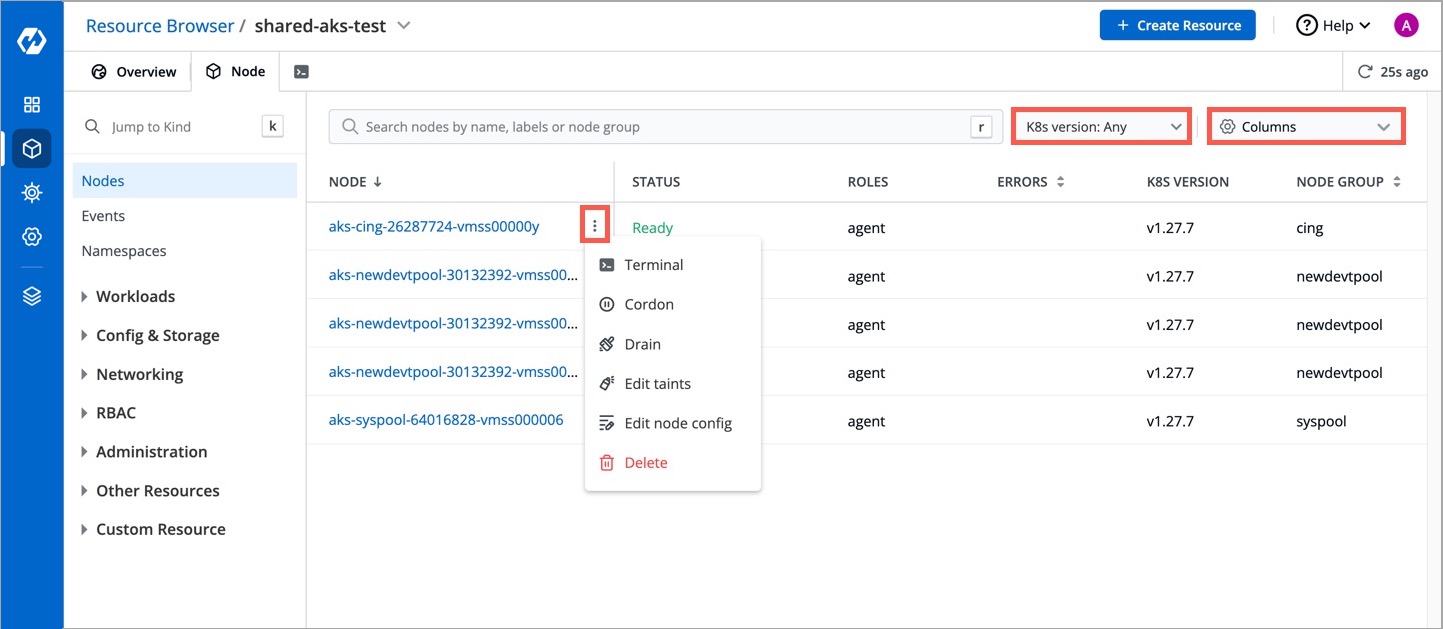
If you have multiple nodes, you can search a node by name or label in the search bar. The search result will display the following information about the node. To display a parameter of a node, use `Columns` on the right side, select the parameter to display from the drop-down list, and click **Apply**.
| Fields | Description |
| ----------- | ---------------------------------------------------------- |
| Node | Alphanumeric name of the node |
| Status | Status of a node. It can be either `Ready` or `Not Ready`. |
| Roles | Shows the roles of a node, e.g., agent |
| Errors | Shows the number of errors in nodes (if any) |
| K8s Version | Shows the version of Kubernetes cluster |
| Node Group | Shows which collection of worker nodes it belongs to |
| No. of Pods | Shows the total number of pods present in the node |
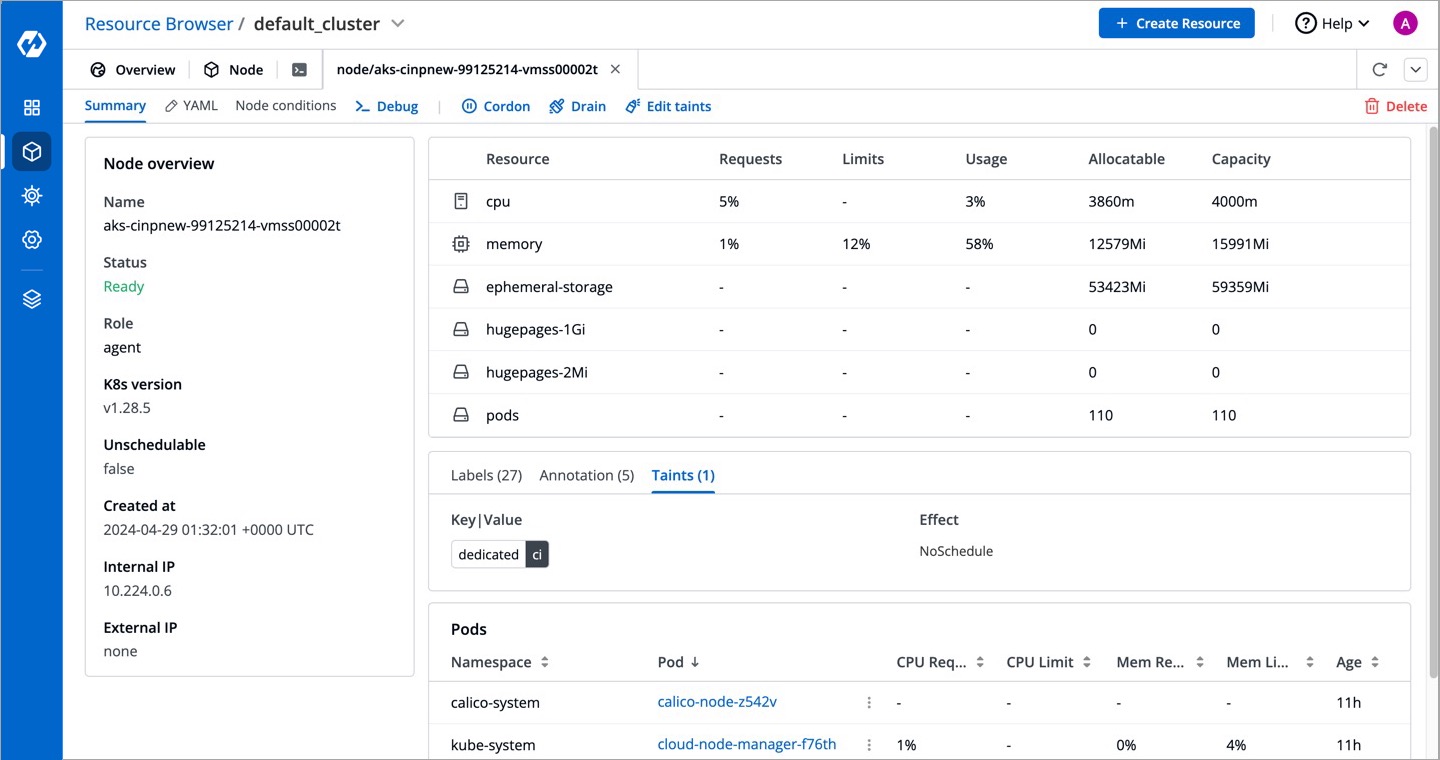
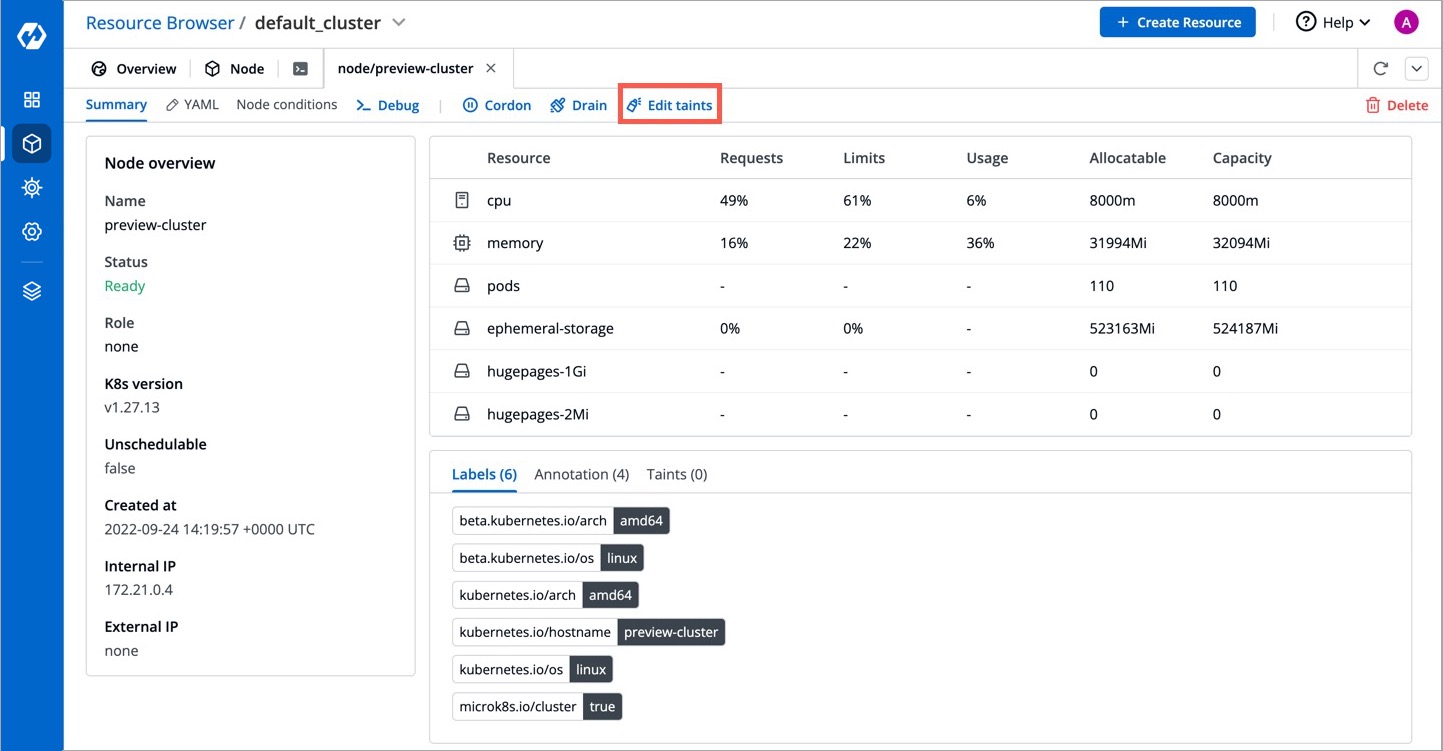
Clicking on a node shows you a number of details such as:
* CPU Usage and Memory Usage of Node
* CPU Usage and Memory Usage of Each Pod
* Number of Pods in the Node
* List of Pods
* Age of Pods
* Labels, Annotations, and Taints
* Node IP
Further using the Devtron UI, you will be able to:
* [Debug a Node](#debug-a-node)
* [Cordon a Node](#cordon-a-node)
* [Drain a Node](#drain-a-node)
* [Taint a Node](#taint-a-node)
* [Edit a Node Config](#edit-a-node-config)
* [Delete a Node](#delete-a-node)
{% hint style="info" %}
#### Why Are Node Operations Required?
Your applications run on pods, and pods run on nodes. But sometimes, Kubernetes scheduler cannot deploy a pod on a node for several reasons, e.g., node is not ready, node is not reachable, network is unavailable, etc. In such cases, node operations help you manage the nodes better.
{% endhint %}
{% hint style="warning" %}
#### Who Can Perform These Actions?
Users need to have super-admin permission to perform node operations.
{% endhint %}
## Debug a Node
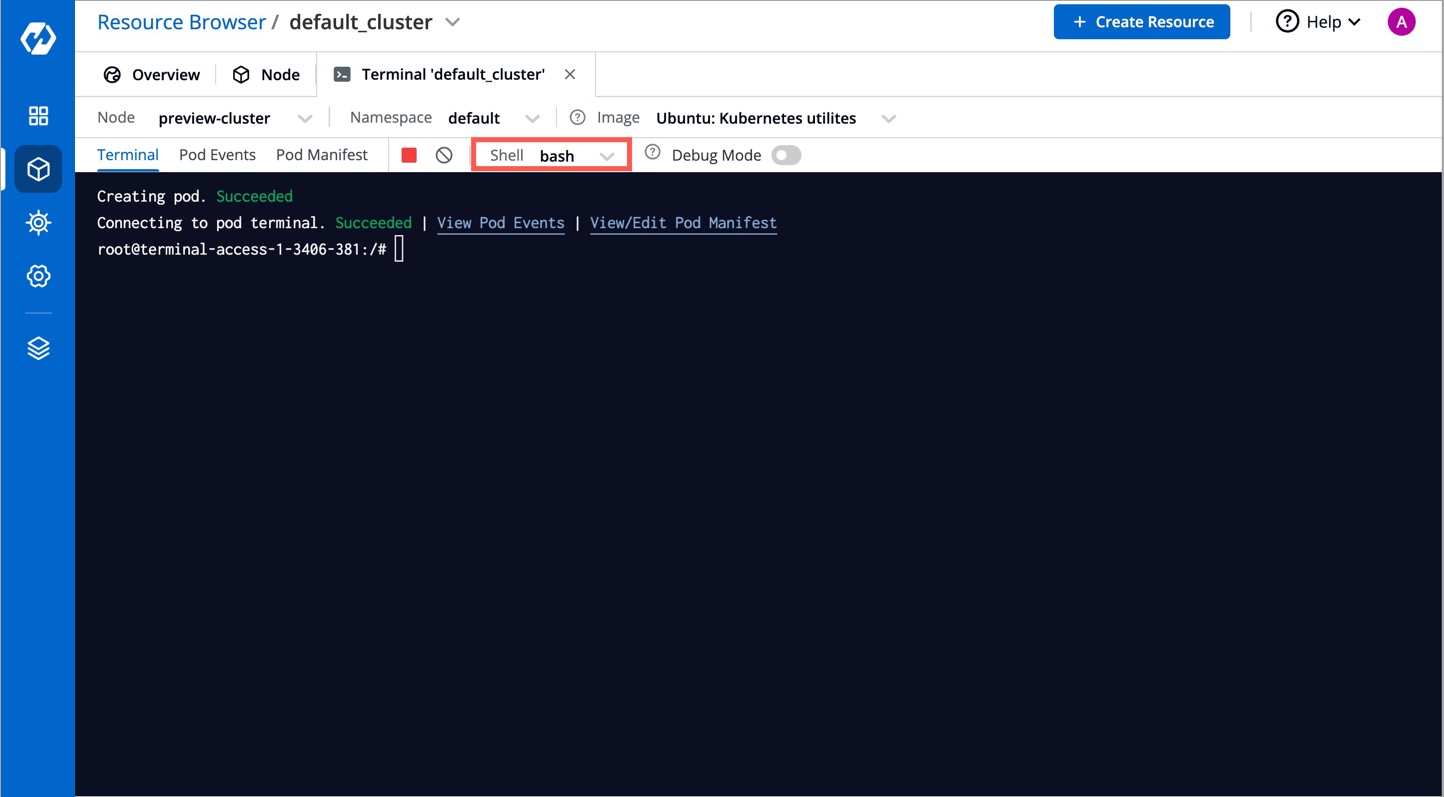
You can debug a node via [Cluster Terminal](/user-guide/resource-browser/terminal.md) by selecting your namespace and image from the list that has all CLI utilities like kubectl, helm, netshoot etc. or can use a custom image, which is publicly available.
* Click **Debug**.
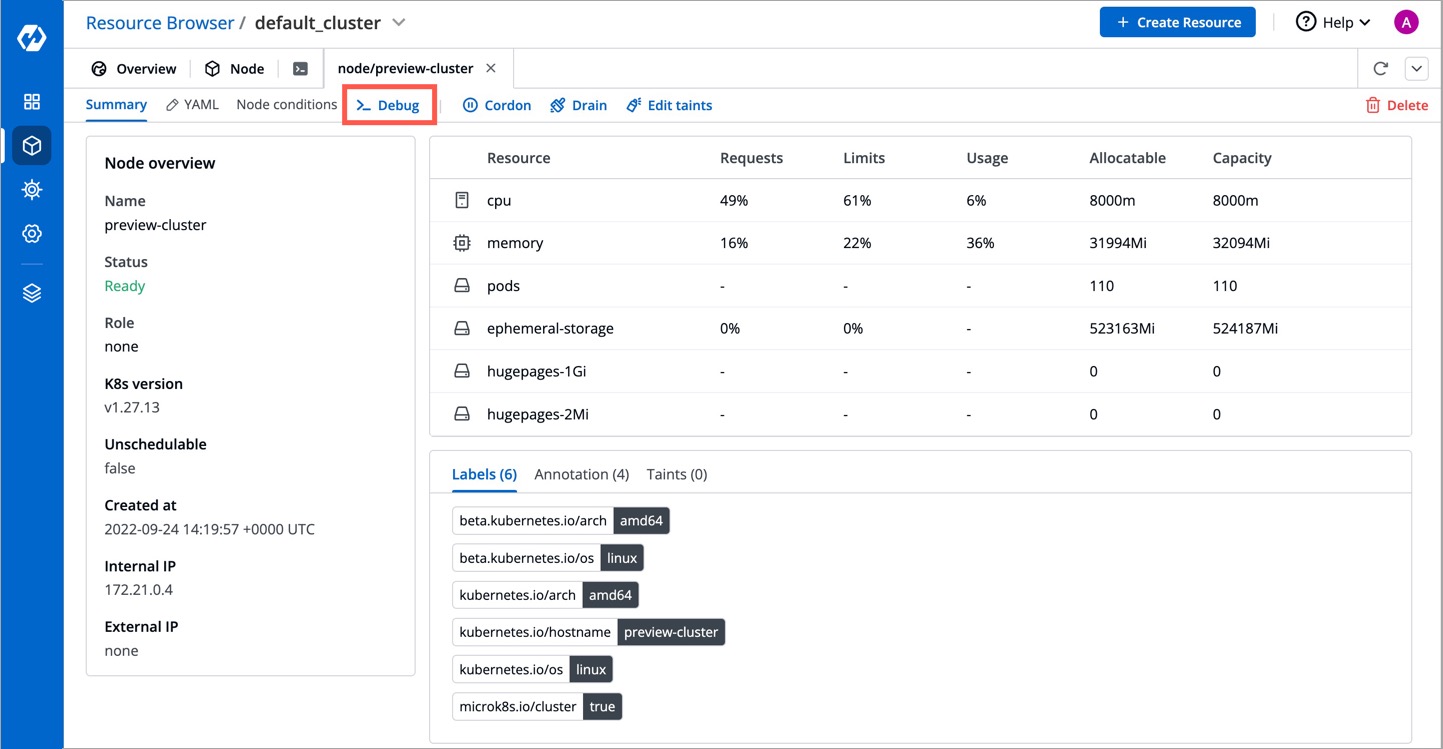
* Debug a node by selecting the terminal shell, i.e., `bash` or `sh`.
***
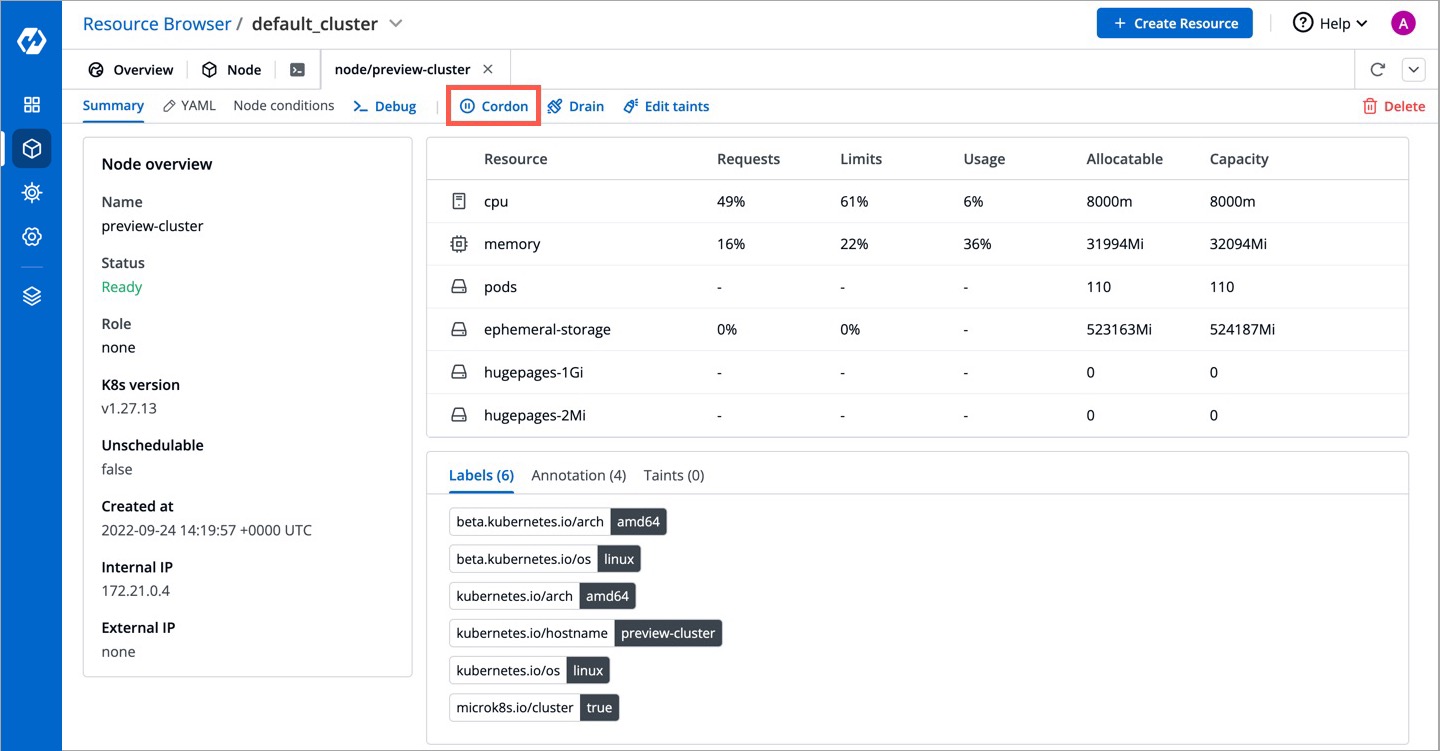
## Cordon a Node
Cordoning a node means making the node unschedulable. After [cordoning a node](https://kubernetes.io/docs/reference/kubectl/generated/kubectl_cordon/), new pods cannot be scheduled on this node.

* Click **Cordon**.
* A confirmation dialog box will appear, click **Cordon Node** to proceed.
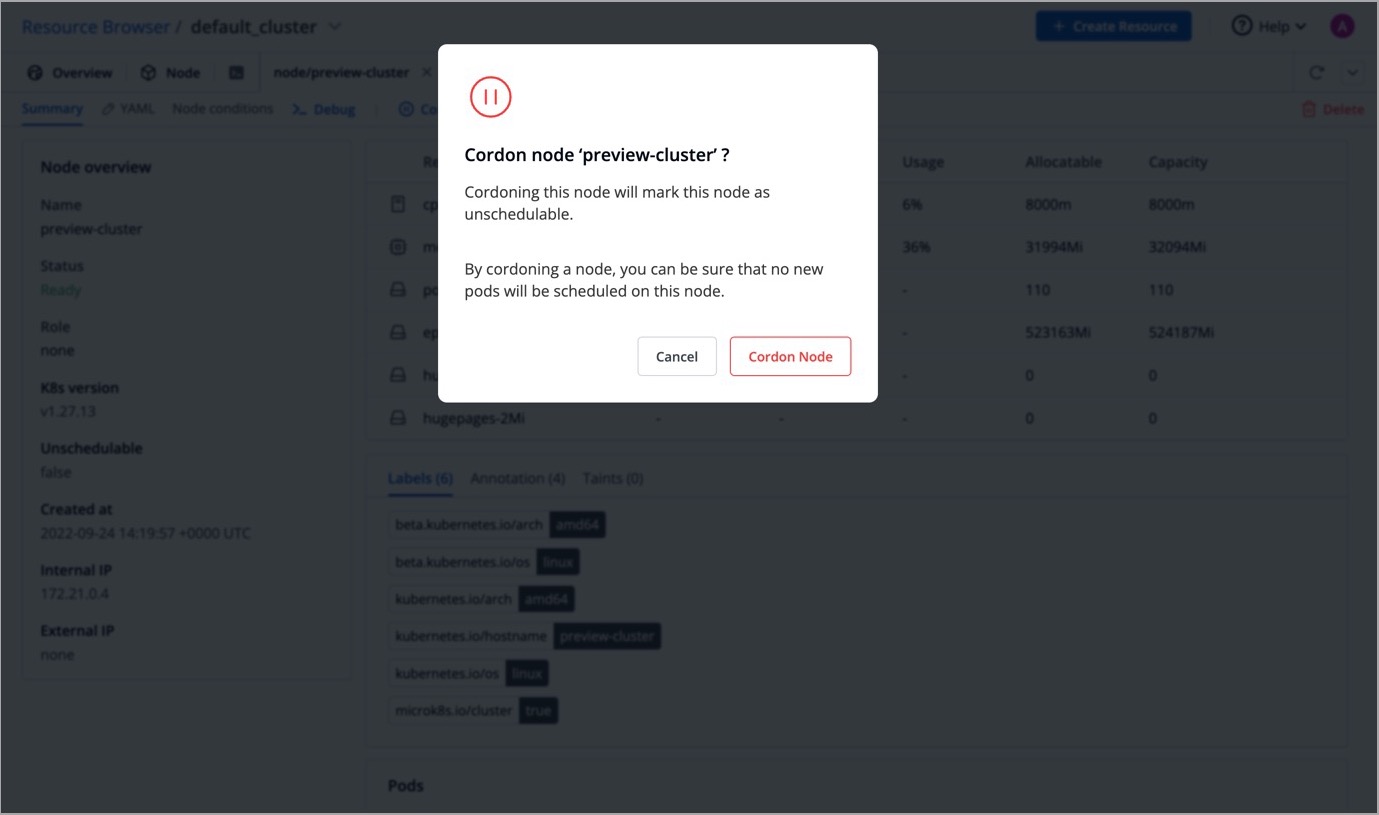
The status of the node shows `SchedulingDisabled` with `Unschedulable` parameter set as `true`.
Similarly, you can uncordon a node by clicking `Uncordon`. After a node is uncordoned, new pods can be scheduled on the node.
***
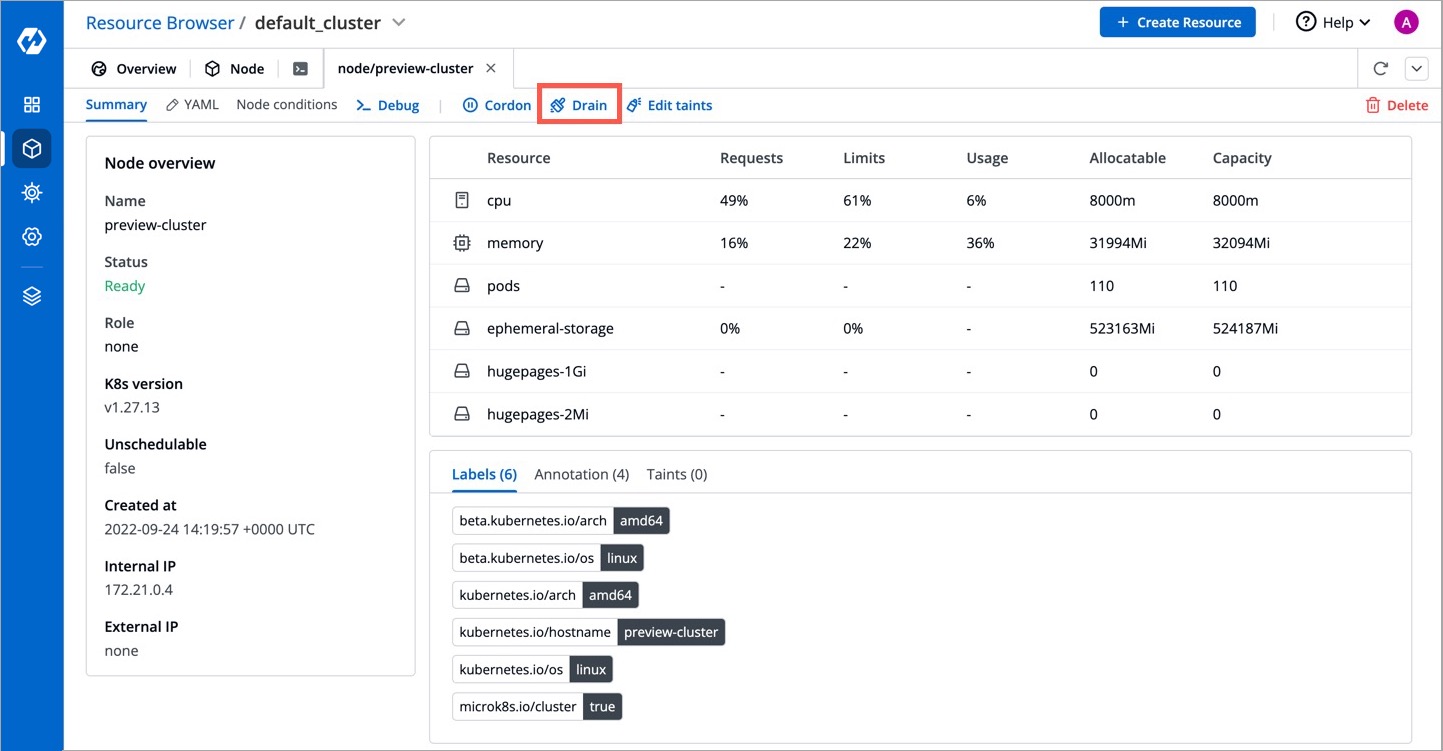
## Drain a Node
Before performing maintenance on a node, [draining a node](https://kubernetes.io/docs/tasks/administer-cluster/safely-drain-node/) evicts all of your pods safely from a node. Safe evictions allow the pod’s containers to gracefully terminate and honour the `PodDisruptionBudgets` you have specified (if relevant).

After the node is drained, all pods (including those managed by DaemonSets) in the node will be automatically drained to other nodes in the cluster, and the drained node will be set to cordoned status.
* Click **Drain**.
* A confirmation dialog box will appear, click **Drain Node** to proceed.
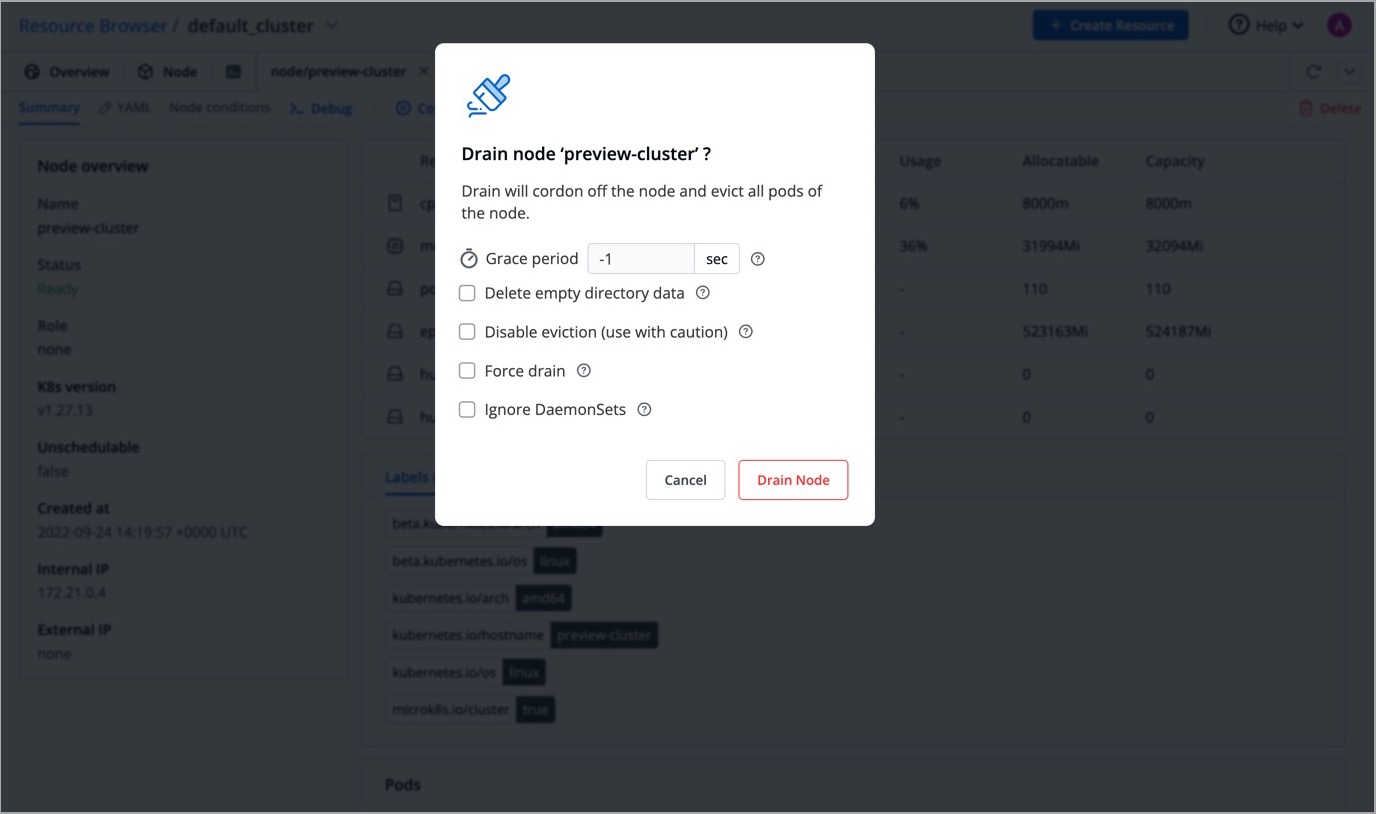
You can also select from the following conditions before draining a node:
| Name | Usage |
| ----------------------------------- | -------------------------------------------------------------------------------------------------------------------------------------------------------------------------------------------------- |
| Grace Period | Period of time in seconds given to each pod to terminate gracefully. If negative, the default value specified in the pod will be used. |
| Delete empty directory data | Enabling this field will delete the pods using empty directory data when the node is drained. |
| Disable eviction (use with caution) | Enabling this field will force drain to use delete, even if eviction is supported. This will bypass checking PodDisruptionBudgets.
Note: Make sure to use with caution.
|
| Force drain | Enabling this field will force drain a node even if there are pods that do not declare a controller. |
| Ignore DaemonSets | Enabling this field will ignore DaemonSet-managed pods. |
***
## Taint a Node
Taints are `key:value` pairs associated with effect. After you add taints to nodes, you can set tolerations on a pod to allow the pod to be scheduled to nodes with certain taints. When you taint a node, it will repel all the pods except those that have a toleration for that taint. A node can have one or many taints associated with it.

**Note**: Make sure to check taint validations before you add a taint.
* Click **Edit taints**.
* Enter the `key:value` pairs and select the [taint effect](#taint-effects) from the drop-down list.
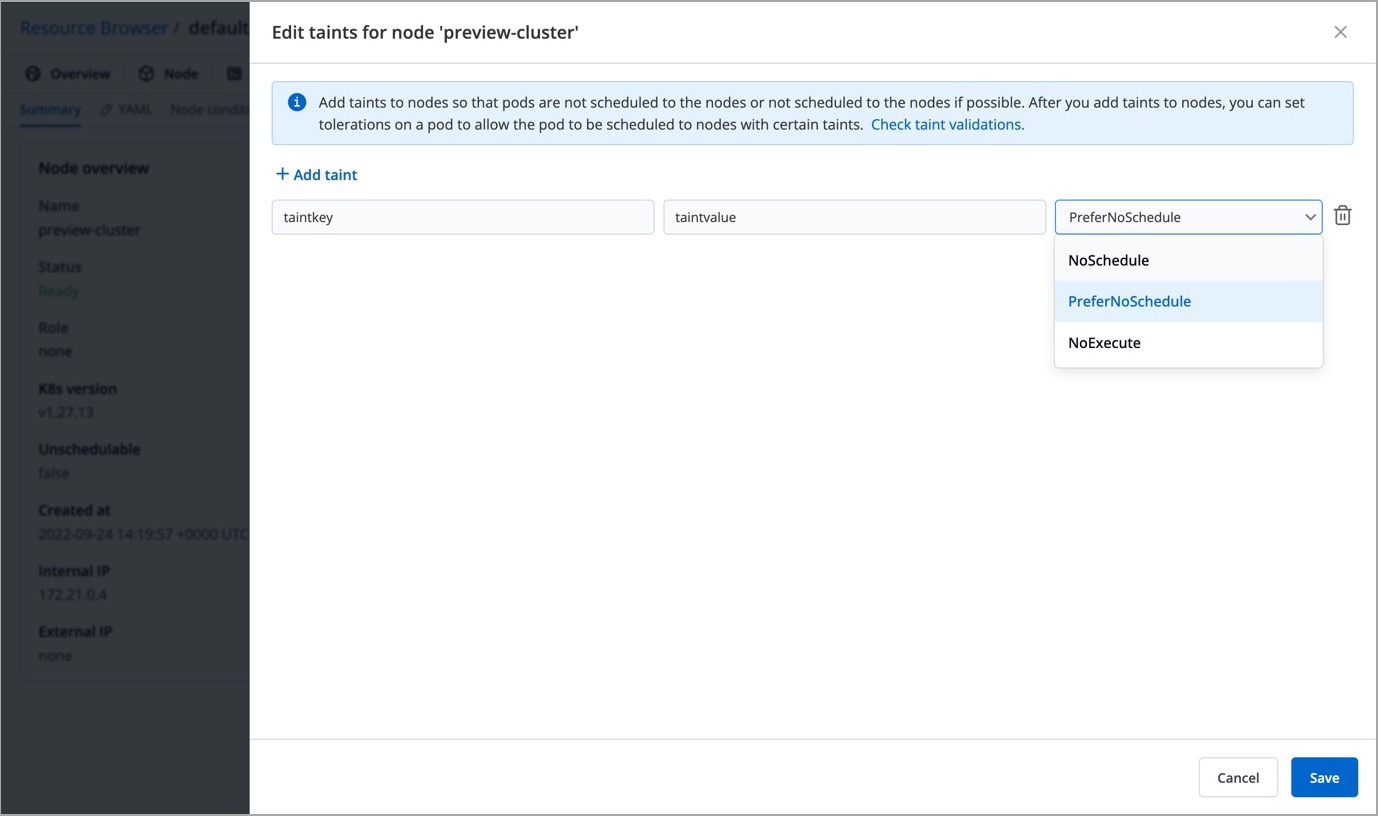
* Click **Save**.
You can also add more taints using **+ Add taint button**, or delete the existing taint by using the delete icon.
{% hint style="info" %}
#### Additional Reference
[Click here](https://kubernetes.io/docs/concepts/scheduling-eviction/taint-and-toleration/#concepts) to read about taint effects.
{% endhint %}
***
## Edit a Node Config
This allows you to directly edit any node. It will open the editor which contains all the configuration settings in which the default format is YAML. You can edit multiple objects, although changes are applied one at a time.

* Go to the `YAML` tab and click **Edit YAML**.
* Make the changes using the editor.
* Click **Review & Save changes** to compare the changes in the YAML file.
* Click **Apply changes** to confirm.
***
## Delete a Node
You can also delete a node by clicking the **Delete** button present on the right-hand side.
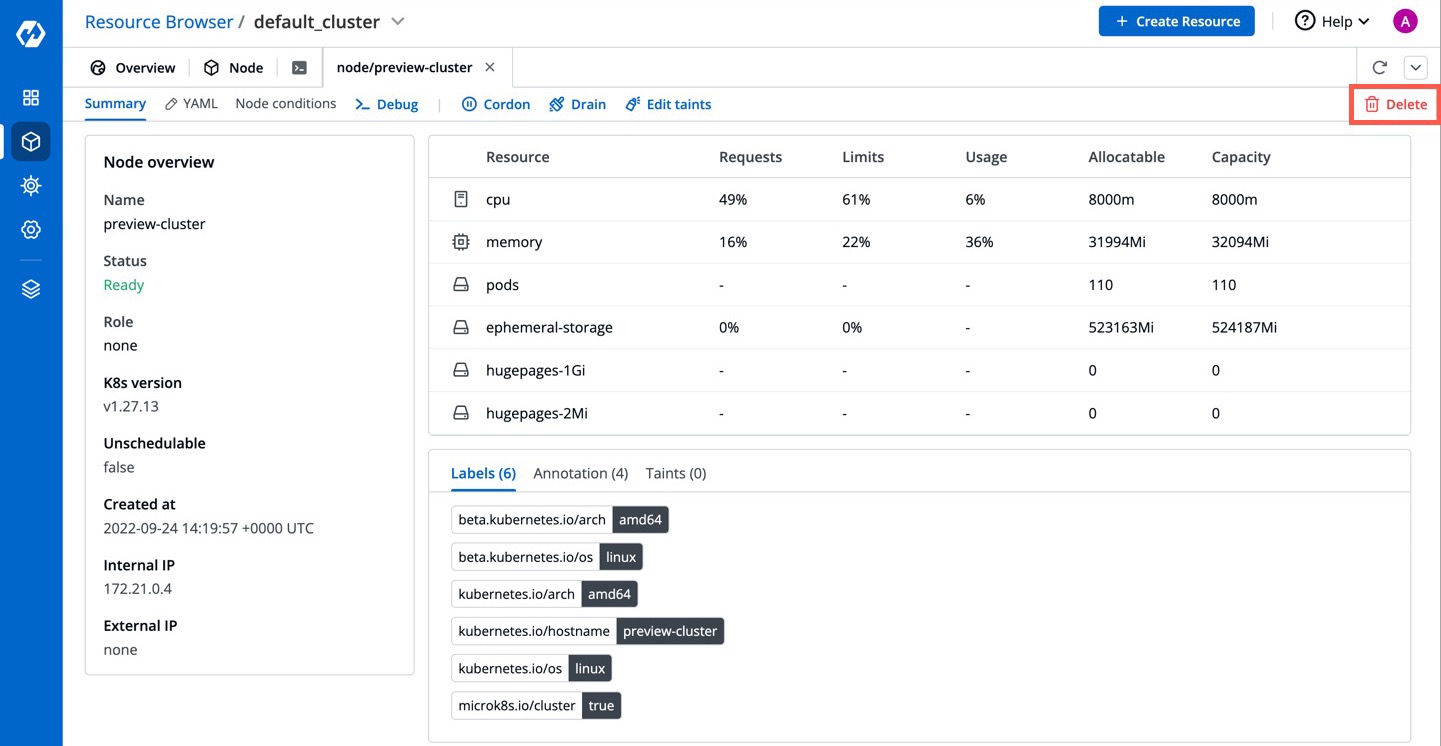
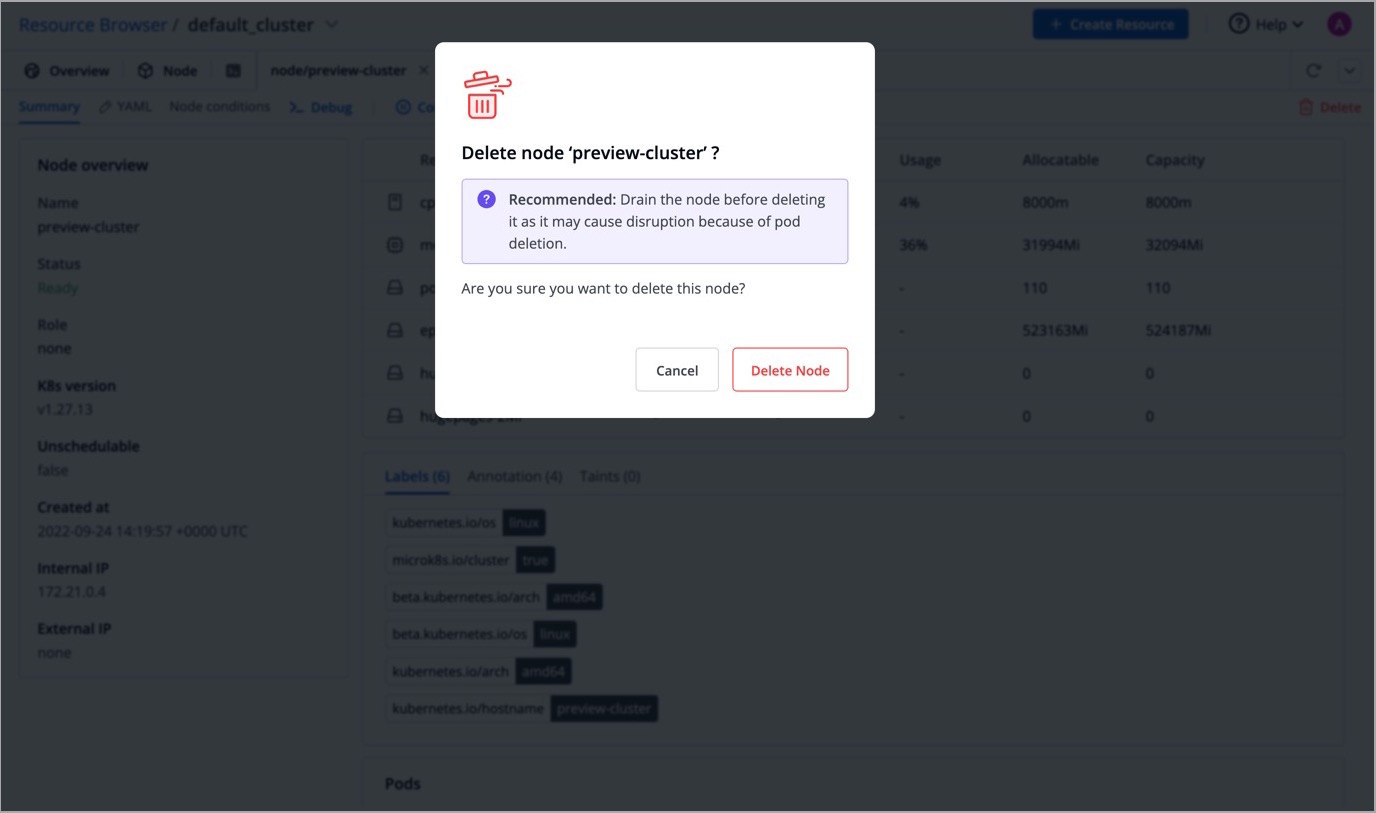
The node will be deleted from the cluster.
{% hint style="info" %}
You can also access [Cluster Terminal](/user-guide/resource-browser/terminal.md) from your node.
{% endhint %}
---
# Agent Instructions
This documentation is published with GitBook. GitBook is the documentation platform designed so that both humans and AI agents can read, navigate, and reason over technical content effectively. Learn more at gitbook.com.
## Querying This Documentation
If you need additional information that is not directly available in this page, you can query the documentation dynamically by asking a question.
Perform an HTTP GET request on the current page URL with the `ask` query parameter, and the optional `goal` query parameter:
```
GET https://docs.dashboard.devtron.ai/user-guide/resource-browser/nodes.md?ask=&goal=
```
`ask` is the immediate question: it should be specific, self-contained, and written in natural language.
`goal` is optional and describes the broader end goal you are ultimately trying to accomplish on behalf of the user. GitBook uses it to tailor the answer towards what is most useful for that goal.
The response will contain a direct answer to the question and relevant excerpts and sources from the documentation.
Use this mechanism when the answer is not explicitly present in the current page, you need clarification or additional context, or you want to retrieve related documentation sections.